- Science News
- Open science and peer review
- New Data Debunks Old Beliefs: Part 2
New Data Debunks Old Beliefs: Part 2
Our original New data debunks old beliefs blog post plotted the impact factors of 570 randomly selected journals indexed in the 2014 Journal Citation Reports (Thomson Reuters, 2015), against their publicly stated rejection rates. The goal was to understand the relationship between rejection rates and journal quality. Despite a widespread belief that high rejection rates secure high impact factors, no significant correlation was found. This study was preliminary, to start a discussion, because it suggests that such an entrenched belief may be wrong.
This blog post is going one step further by removing what could be the main reason why we could not find any correlation: varying citation rates across academic fields. It is widely known that articles in some fields typically get more citations than in other fields. Perhaps a correlation would become evident once we removed this variable.
In Figures 1-7 below, we normalized the impact factors by field, thus effectively removing this variable from the results (data accessible here). We have done this by calculating the ranking of each journal within its own Journal Citation Reports category (or field). As an example, a journal that has the 4th largest IF among 200 journals in its category will be (1-(4/200)) or 98% percentile on the Y axis in all the figures below. In other words, this indicates that it’s impact factor is higher than 98% of journals in its category.
Thomson Reuters groups the 200+ categories within 5 major Research areas (see ref 1). We also wanted to know whether the results differed between them and if some showed a correlation between rejection rate and impact factor percentile. The 5 research areas are listed below. Figures 1 through 5 each covers one of the 5 areas.
o Arts Humanities |
o Life Sciences Biomedicine |
o Physical Sciences |
o Social Sciences |
o Technology |
We notice that the correlation never exceeds 0.05 (Life Sciences and Biomedicine) and is even negative for the Physical Sciences. The correlation for Arts and Humanities isn’t shown as we only obtained two data points.
Figures 6 shows all 5 Research areas combined. We notice that each has a similar spread over both axis, except for the Social Sciences which tend to have higher rejection rates (purple dots). Figure 7 is identical to Figure 6 but shows the overall correlation for all 568 journals in all 5 Research areas, which stands at 0.0187, with a P-value of 0.0011. Hence once we normalize by field, the rejection rate still only explains less than 2% of the overall variation in impact factor. Furthermore, no significant correlation exists at the Research area level either. Our initial conclusion therefore seems to hold, even when removing the field variable: Rejection rates have little influence on the impact factor.
A similar study by Aarssen et al. came to the opposite conclusion (see ref 2): that there is a strong correlation (0.687) between rejection rates and impact factors. However, their study only focused on a single field, namely Ecology while our study covers over 156 Journal Citation Reports categories (about 2/3rds of all categories). They also performed their analysis on only 60 journals, while we obtained the data for 568 journals. Lastly, their small sample size is over a decade old (2004). A more recent study will be required to determine whether the Aarssen et al. study’s conclusions still hold for Ecology today.

Figure 1: Arts and Humanities journals with rejection rates and impact factor percentiles (for sources, see below). Impact factors from Thomson Reuters Journal Citation Reports (2014).

Figure 2: Life Sciences and Biomedicine journals with rejection rates and impact factor percentiles (for sources, see below). Impact factors from Thomson Reuters Journal Citation Reports (2014).

Figure 3: Physical Sciences journals with rejection rates and impact factor percentiles (for sources, see below). Impact factors from Thomson Reuters Journal Citation Reports (2014).

Figure 4: Social Sciences journals with rejection rates and impact factor percentiles (for sources, see below). Impact factors from Thomson Reuters Journal Citation Reports (2014).
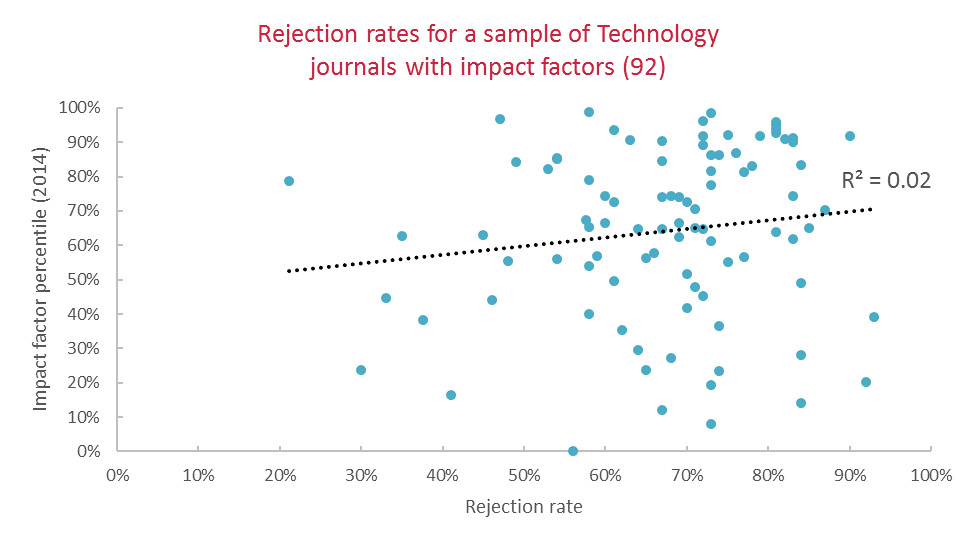
Figure 5: Technology journals with rejection rates and impact factor percentiles (for sources, see below). Impact factors from Thomson Reuters Journal Citation Reports (2014).

Figure 6: Journals from all 5 Research areas with rejection rates and impact factor percentiles (for sources, see below). Impact factors from Thomson Reuters Journal Citation Reports (2014).
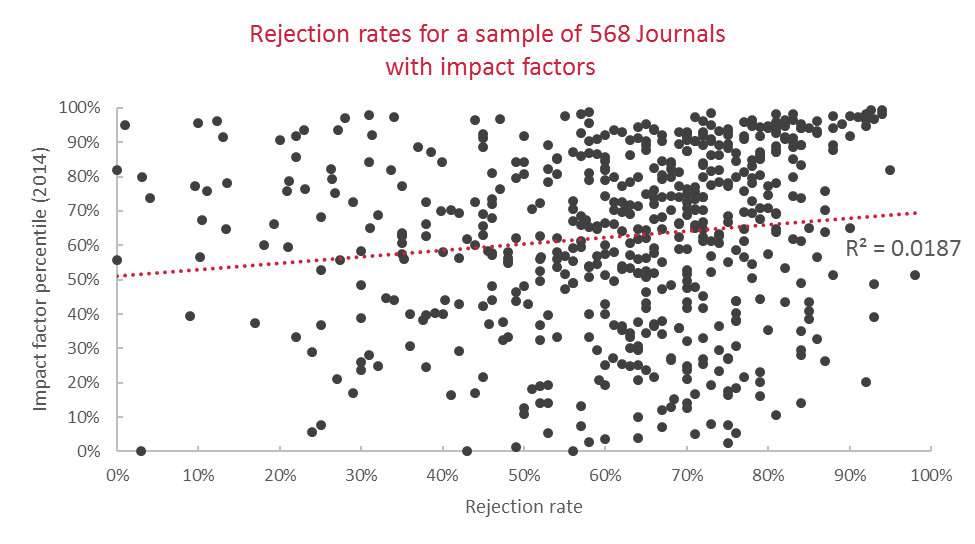
Figure 7: Journals from all 5 Research areas with rejection rates and impact factor percentiles (for sources, see below). Impact factors from Thomson Reuters Journal Citation Reports (2014).
Note:
The sample is identical to the original blog post, except that 2 journals couldn’t be included. One has been removed from the 2014 Journal Citation Reports (The North American Journal of Economics and Finance) while the other journal had an impact factor mentioned on its page but that was from the 2012 JCR. It is no longer listed (although it will be back in the 2016 JCR).
References
1. http://images.webofknowledge.com/WOKRS521R5/help/WOS/hp_research_areas_easca.html
2. http://benthamopen.com/ABSTRACT/TOECOLJ-1-1-14
3. Sources for rejection rates (by publisher):
AAAS: http://www.the-scientist.com/?articles.view/articleNo/23672/title/Is-Peer-Review-Broken-/
American Psychological Association:http://www.apa.org/pubs/journals/statistics.aspx (2013 data)
American Medical Association: http://www.the-scientist.com/?articles.view/articleNo/23672/title/Is-Peer-Review-Broken-/
Copernicus: http://journals.ametsoc.org/doi/pdf/10.1175/2009BAMS2908.1
Elife: http://elifesciences.org/elife-news/A-flavour-of-eLife
Elsevier: http://journalfinder.elsevier.com/#results (this is a journal finder)
Frontiers: Internal data for 2013 spontaneous submissions (Original research articles)
Hindawi: All data is from individual journal websites. Has been done for all journals that have an impact factor.
MDPI: http://blog.mdpi.com/2014/03/20/kudos-to-our-peer-reviewers/
NPG: Various sources Nature Materials:http://www.nature.com/nmat/journal/v11/n9/full/nmat3424.html;
Nature Communications: oaspa.org/wp-content/uploads/2012/11/James-Butcher-NPG.pptx;
Nature Neuroscience:http://www.nature.com/neuro/journal/v11/n5/full/nn0508-521.html;
Scientific Reports: http://occamstypewriter.org/trading-knowledge/2012/07/09/megajournals/)
PeerJ: https://peerj.com/about/FAQ/
PLOS:
Taylor and Francis: http://explore.tandfonline.com/content/beh/ntcn-call-for-editor-in-chief